A tour of Rockwall.
See how Rockwall brings scheduling, resourcing, budgets, and reporting together in one platform.
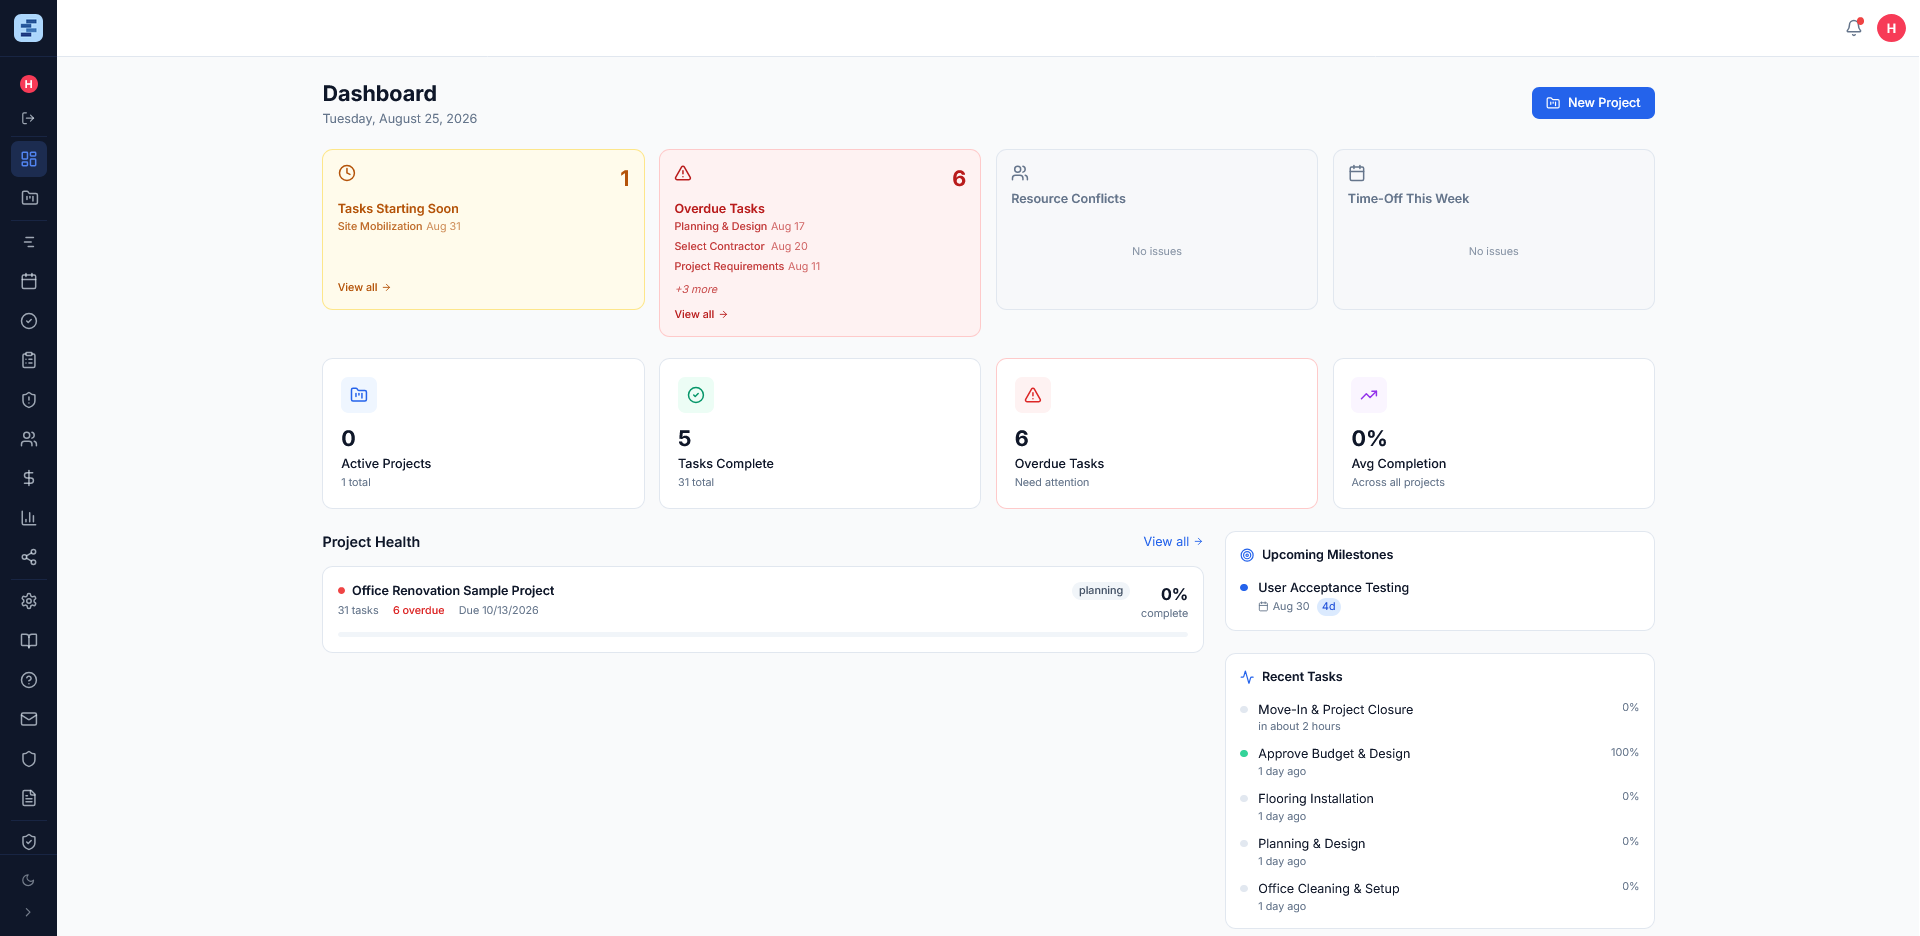
Dashboard
Get an instant read on every project — RAG health status, upcoming milestones, and recent activity — the moment you log in.
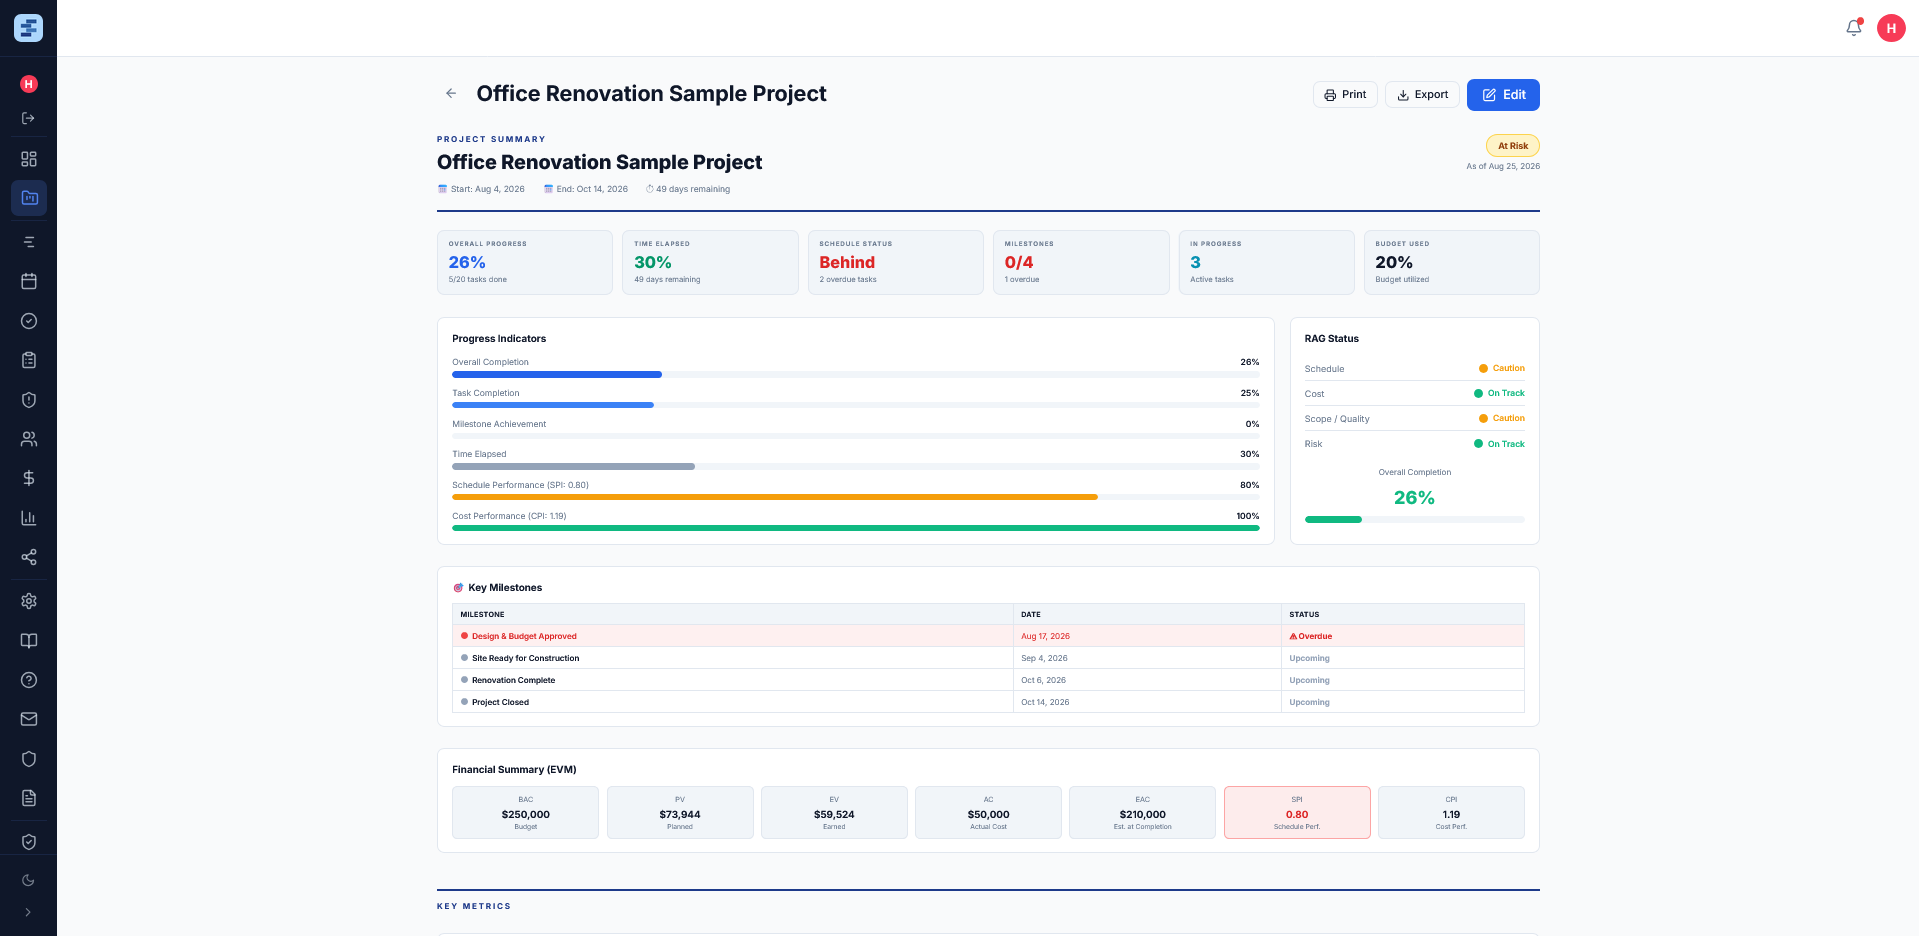
Project Summary
A single-project command centre — progress, RAG health, key milestones, and an EVM financial summary (BAC, PV, EV, AC, EAC, SPI, CPI) in one view.
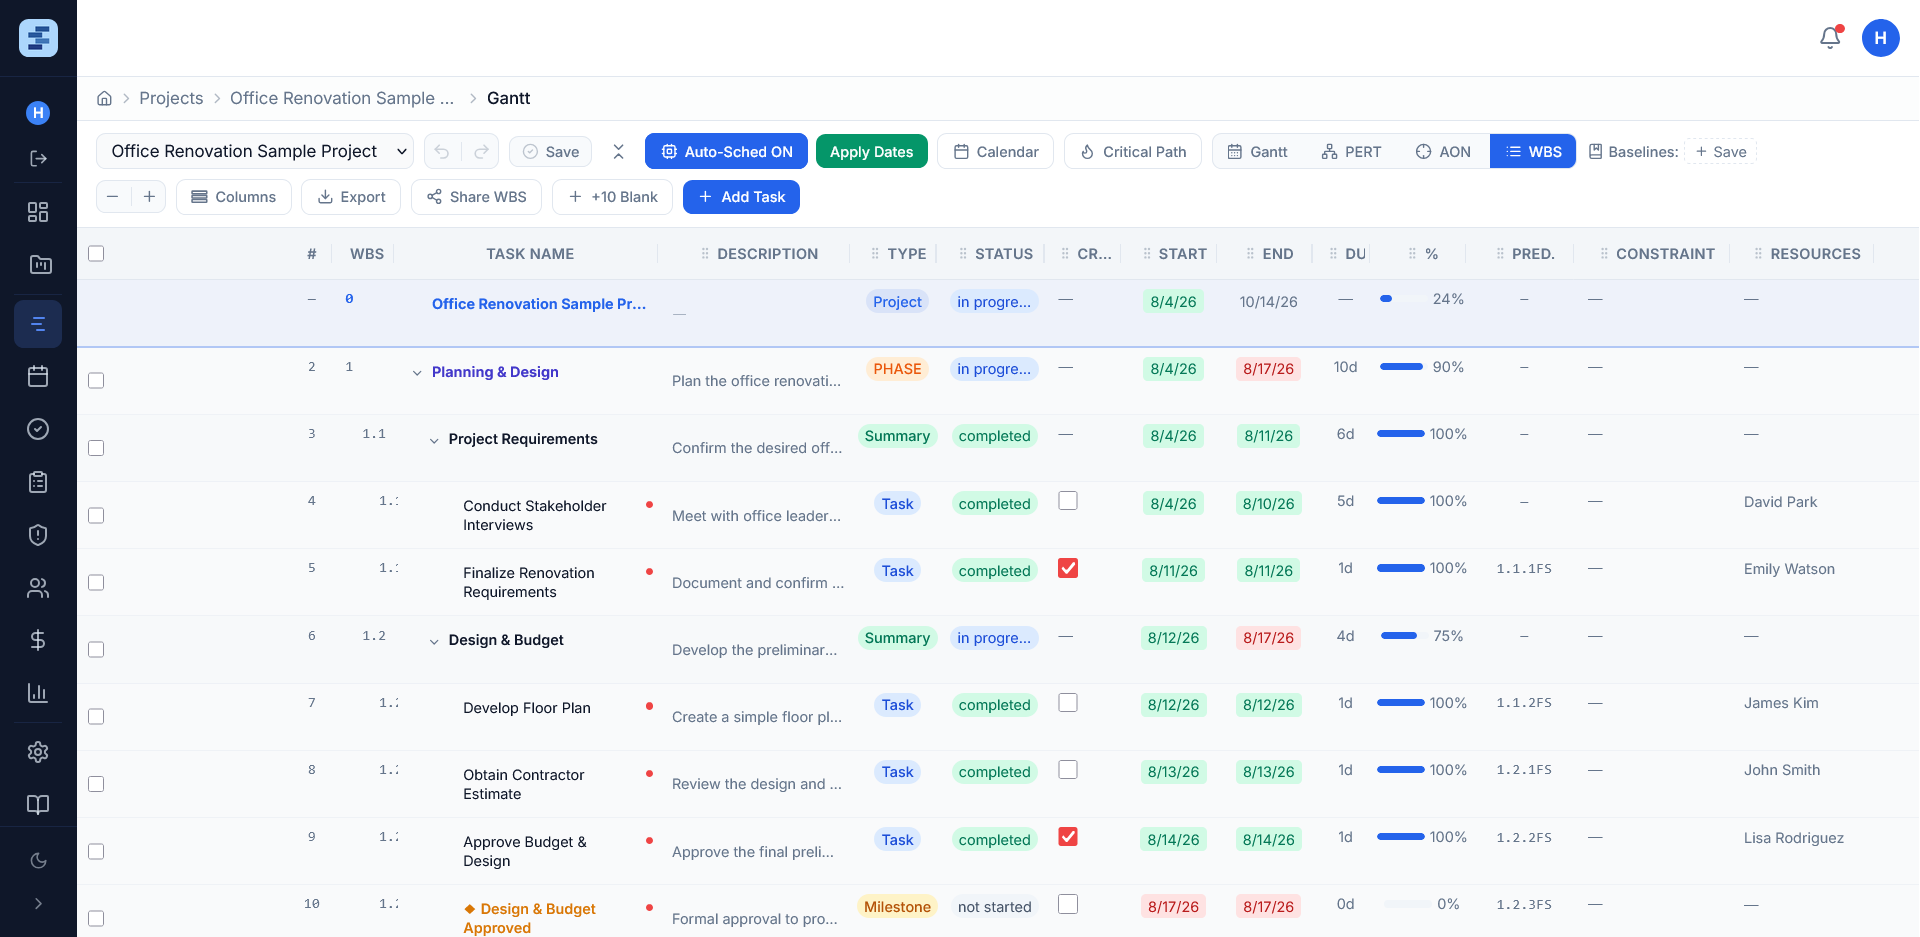
WBS
Build a hierarchical Work Breakdown Structure with numbered tasks, phases, summaries, and milestones — the backbone of every project plan.
View live example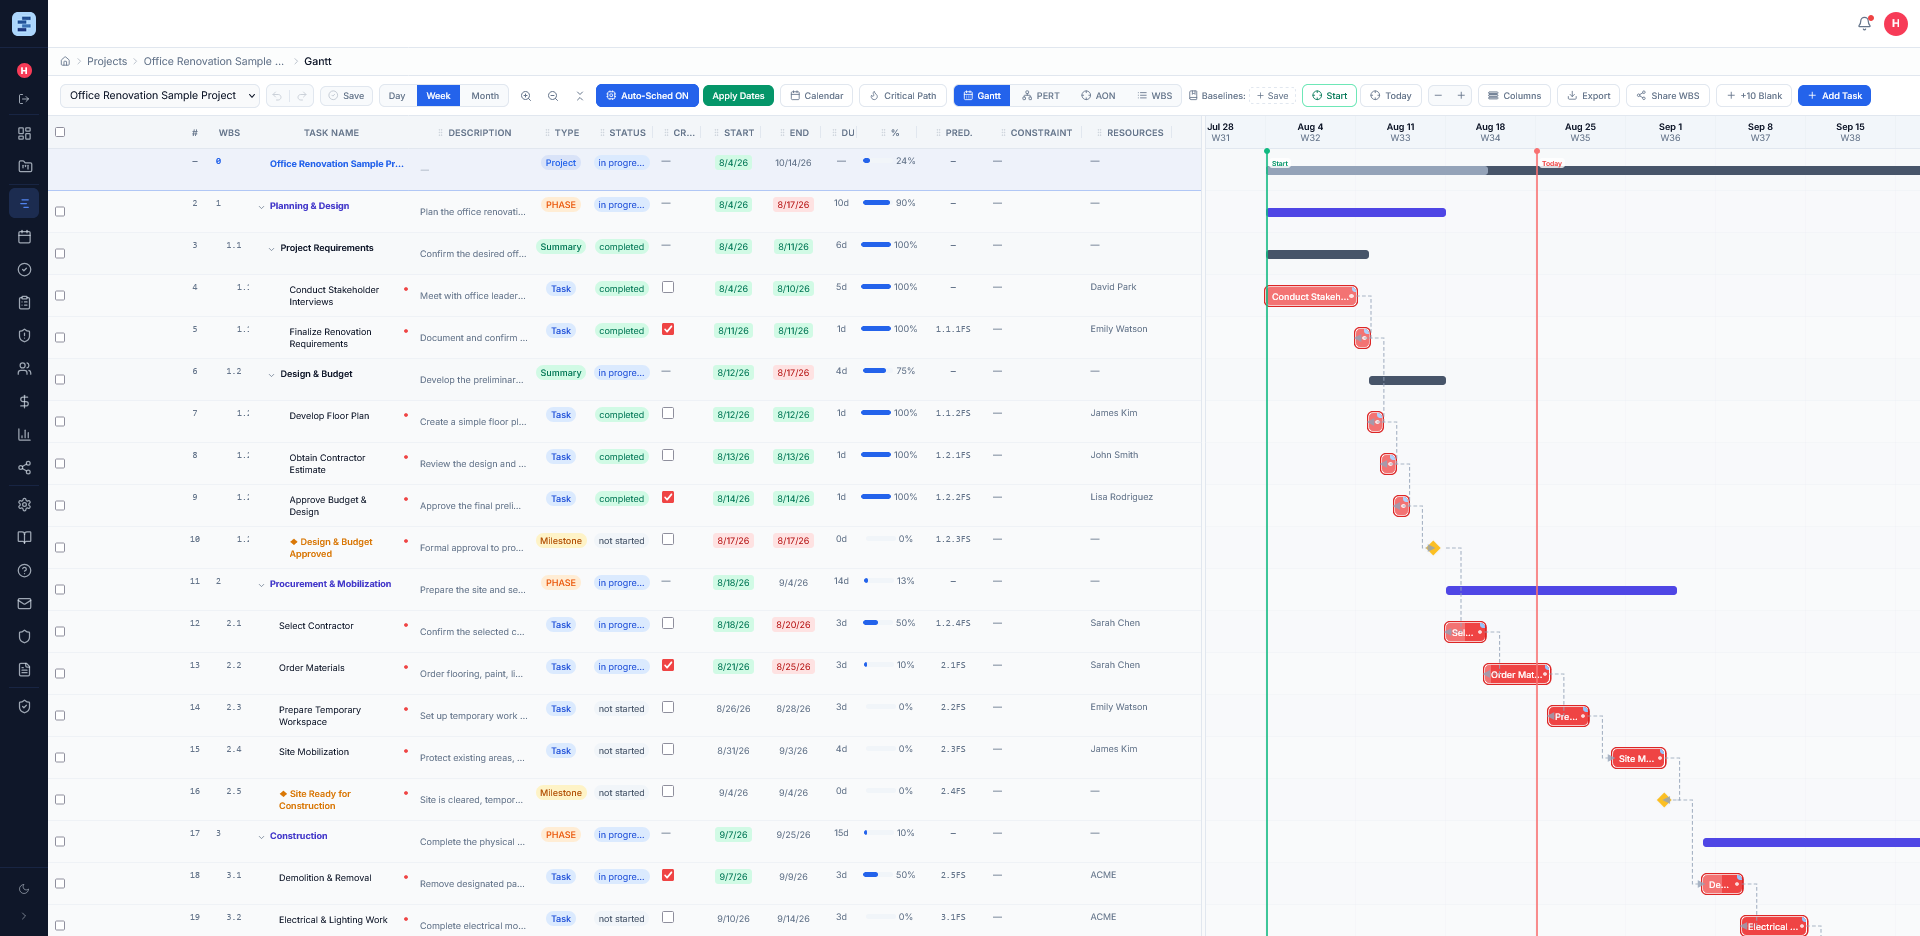
Gantt Chart
Plan and schedule with a full WBS task grid and an interactive Gantt timeline, complete with dependencies, baselines, and critical path highlighting.
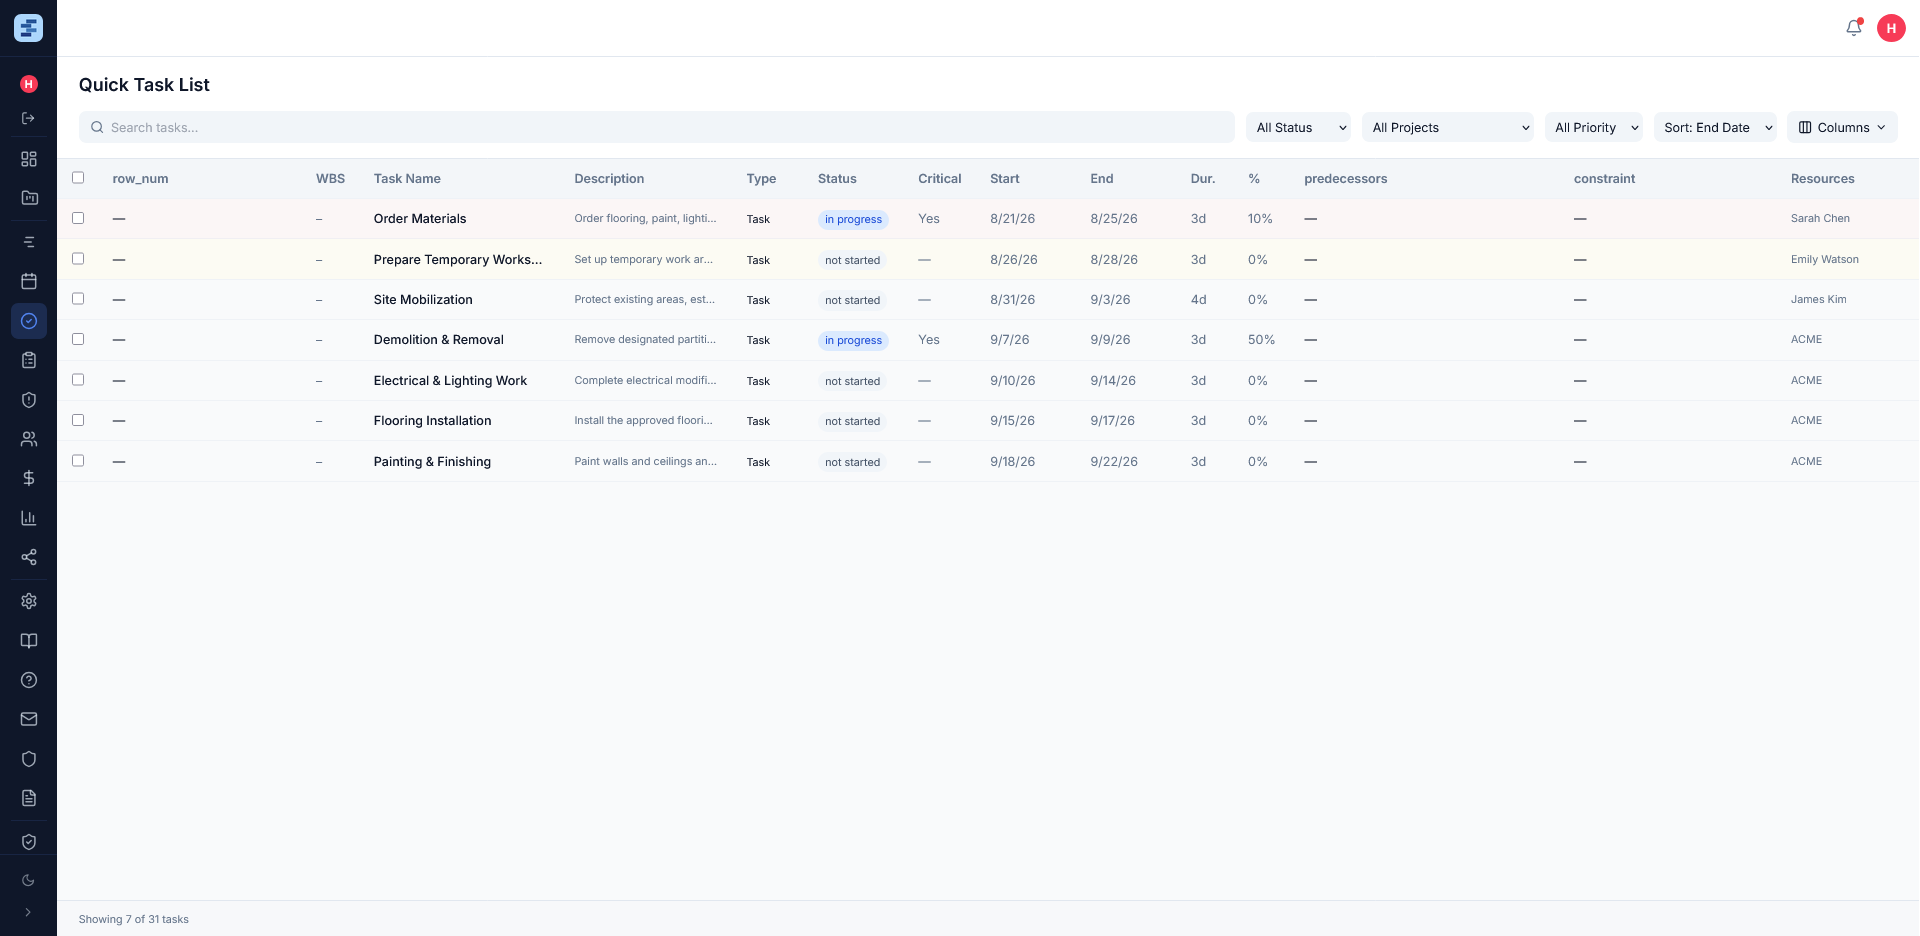
Quick Task List
A flat, fast-scan list of every task across all your projects. Filter by status, priority, and due-date windows to surface exactly what needs attention today.
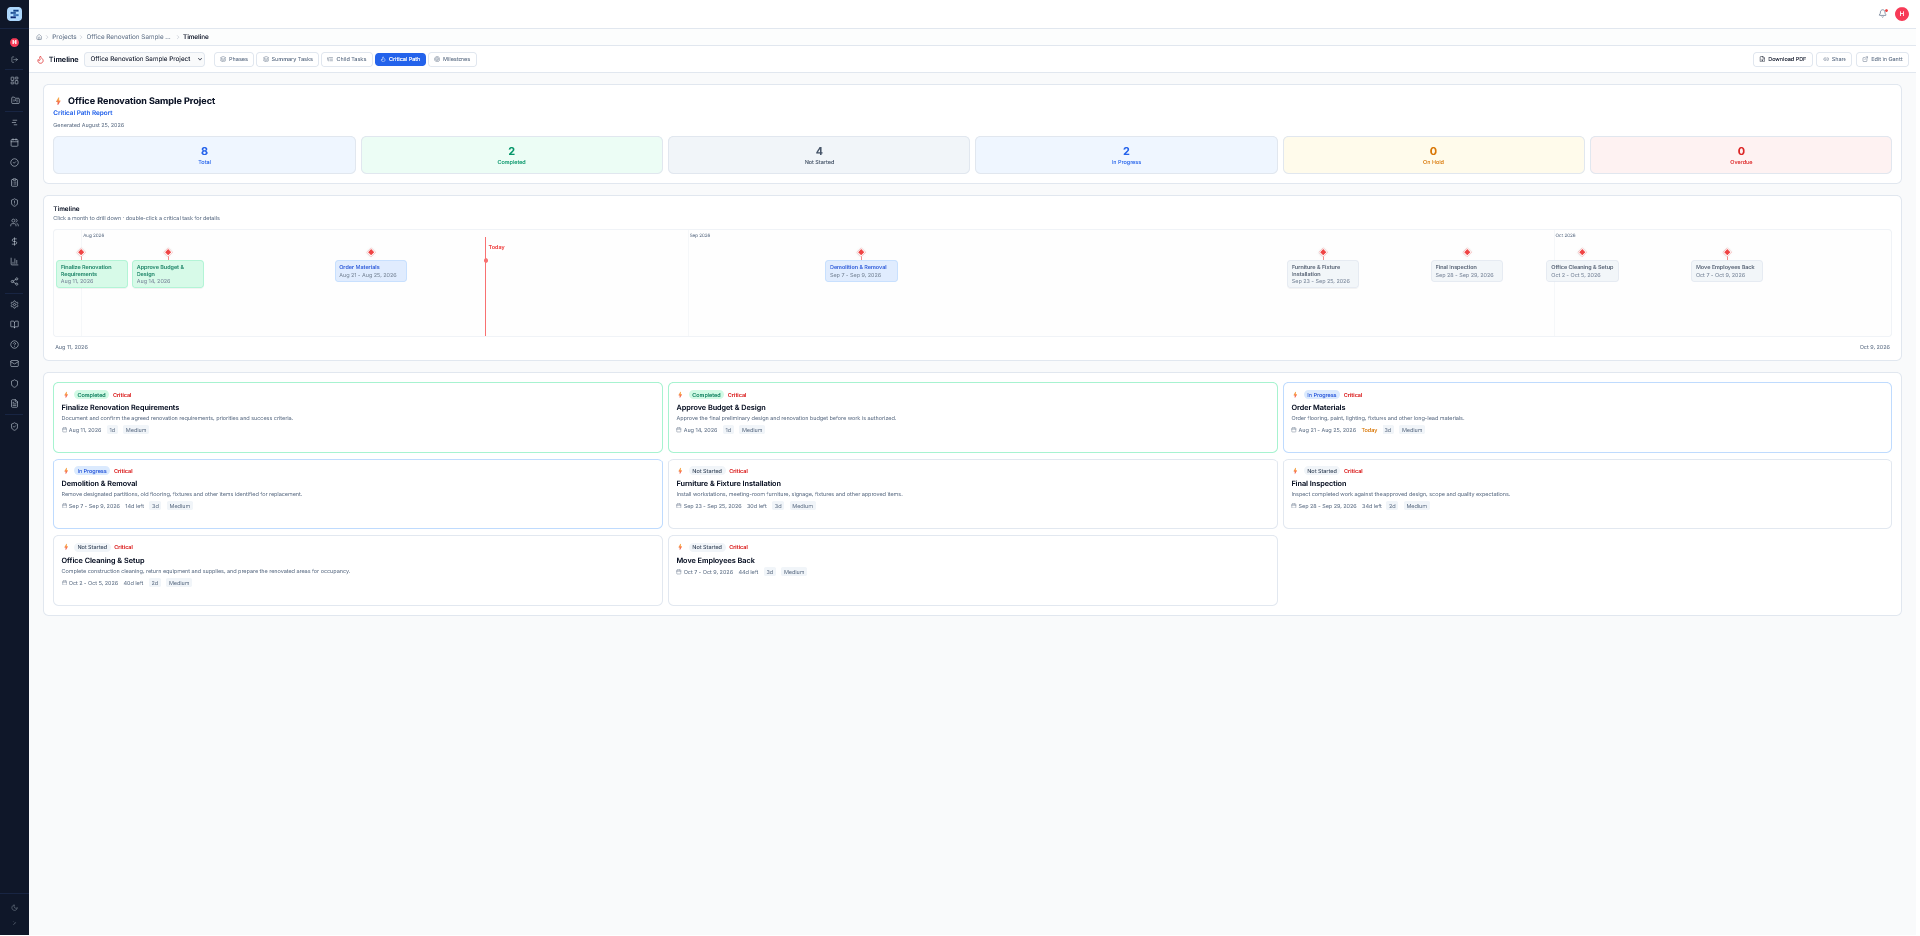
Critical Path
Visualise the chain of tasks that drive your project end date — the critical path timeline flags every task that can’t slip without delaying delivery.
View live example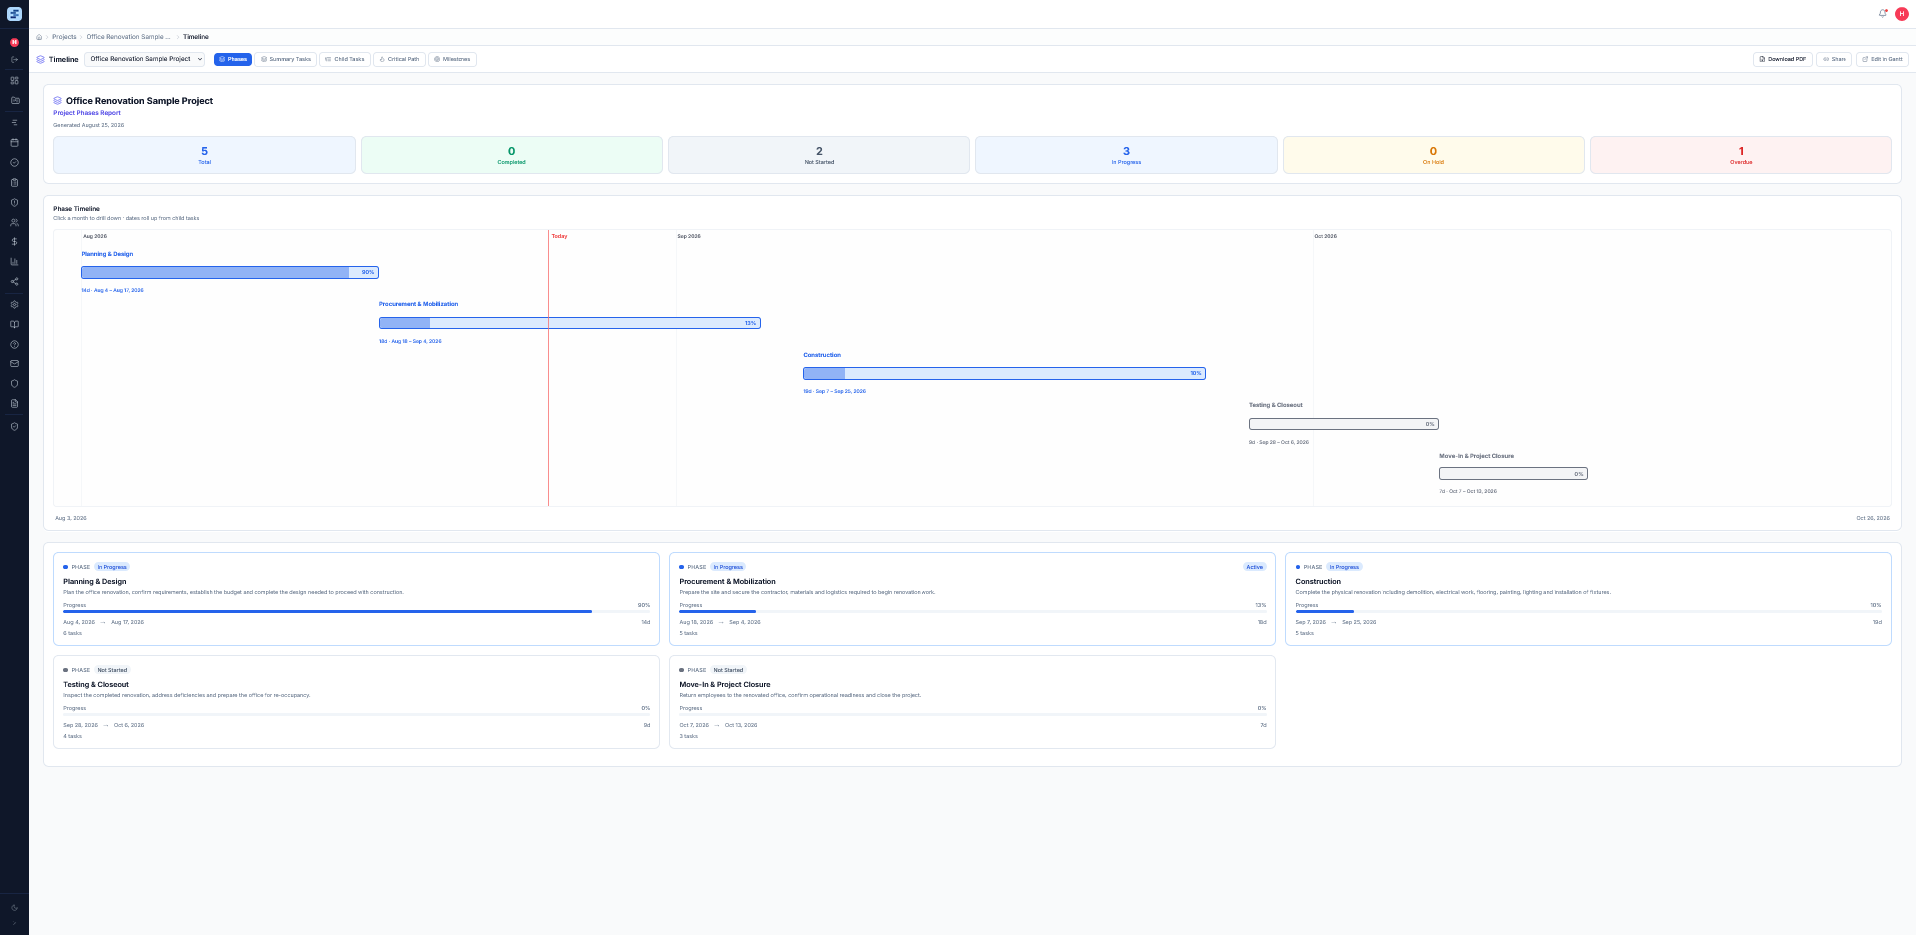
Phases
Group work into phases with rolled-up progress, durations, and status — the executive view of how the project is tracking from start to finish.
View live example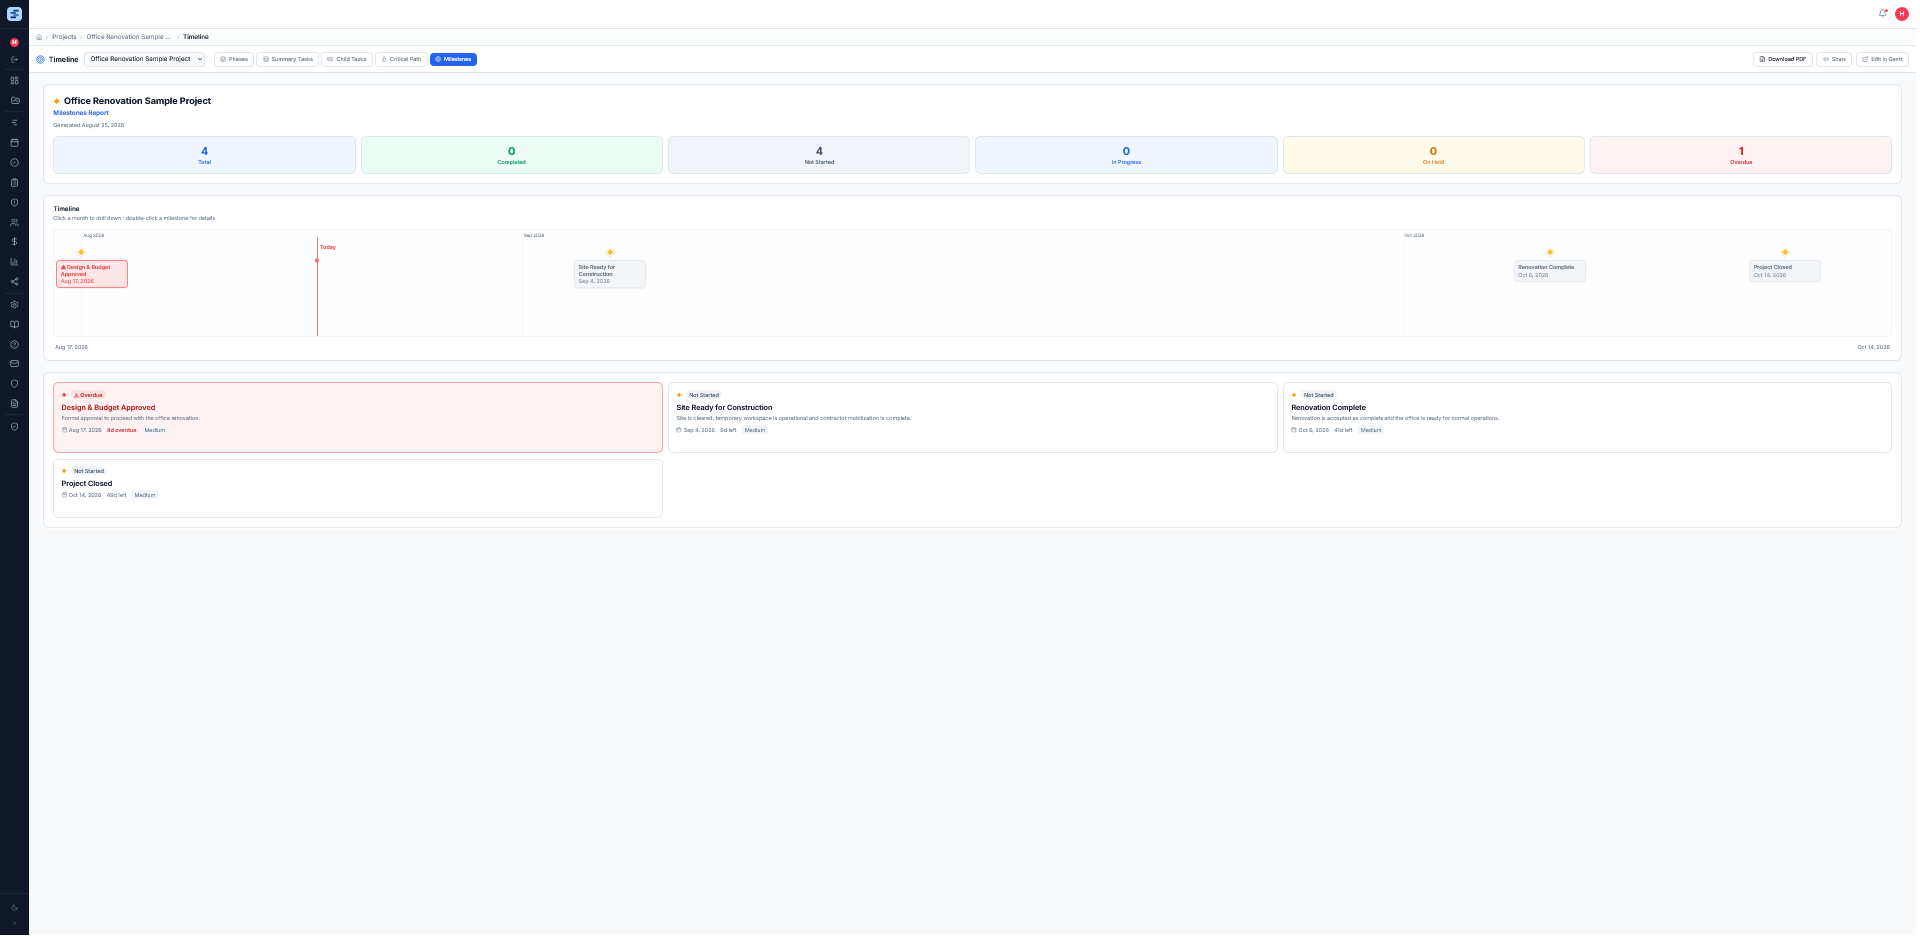
Milestones
Track key delivery gates on a visual timeline, colour-coded by status, so nothing critical slips through the cracks.
View live example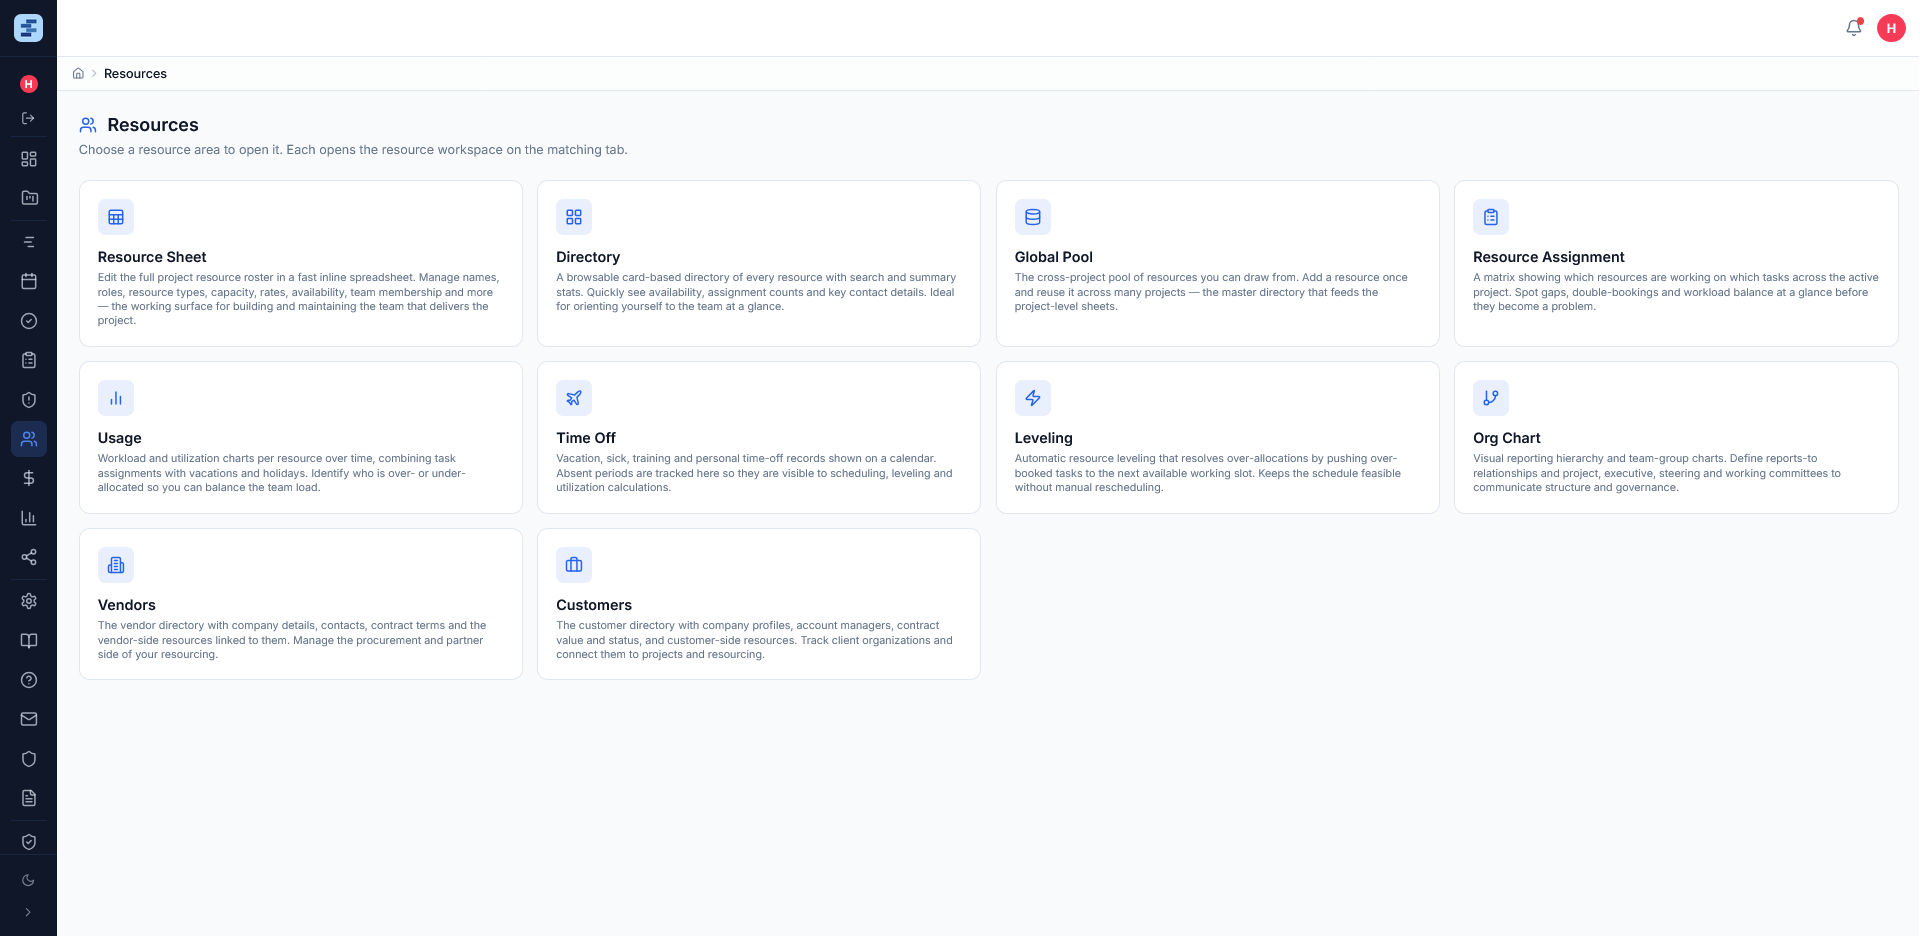
Resource Management
A full resource workspace — sheet, directory, global pool, assignment matrix, usage, time off, leveling, org chart, vendors, and customers — in one place.
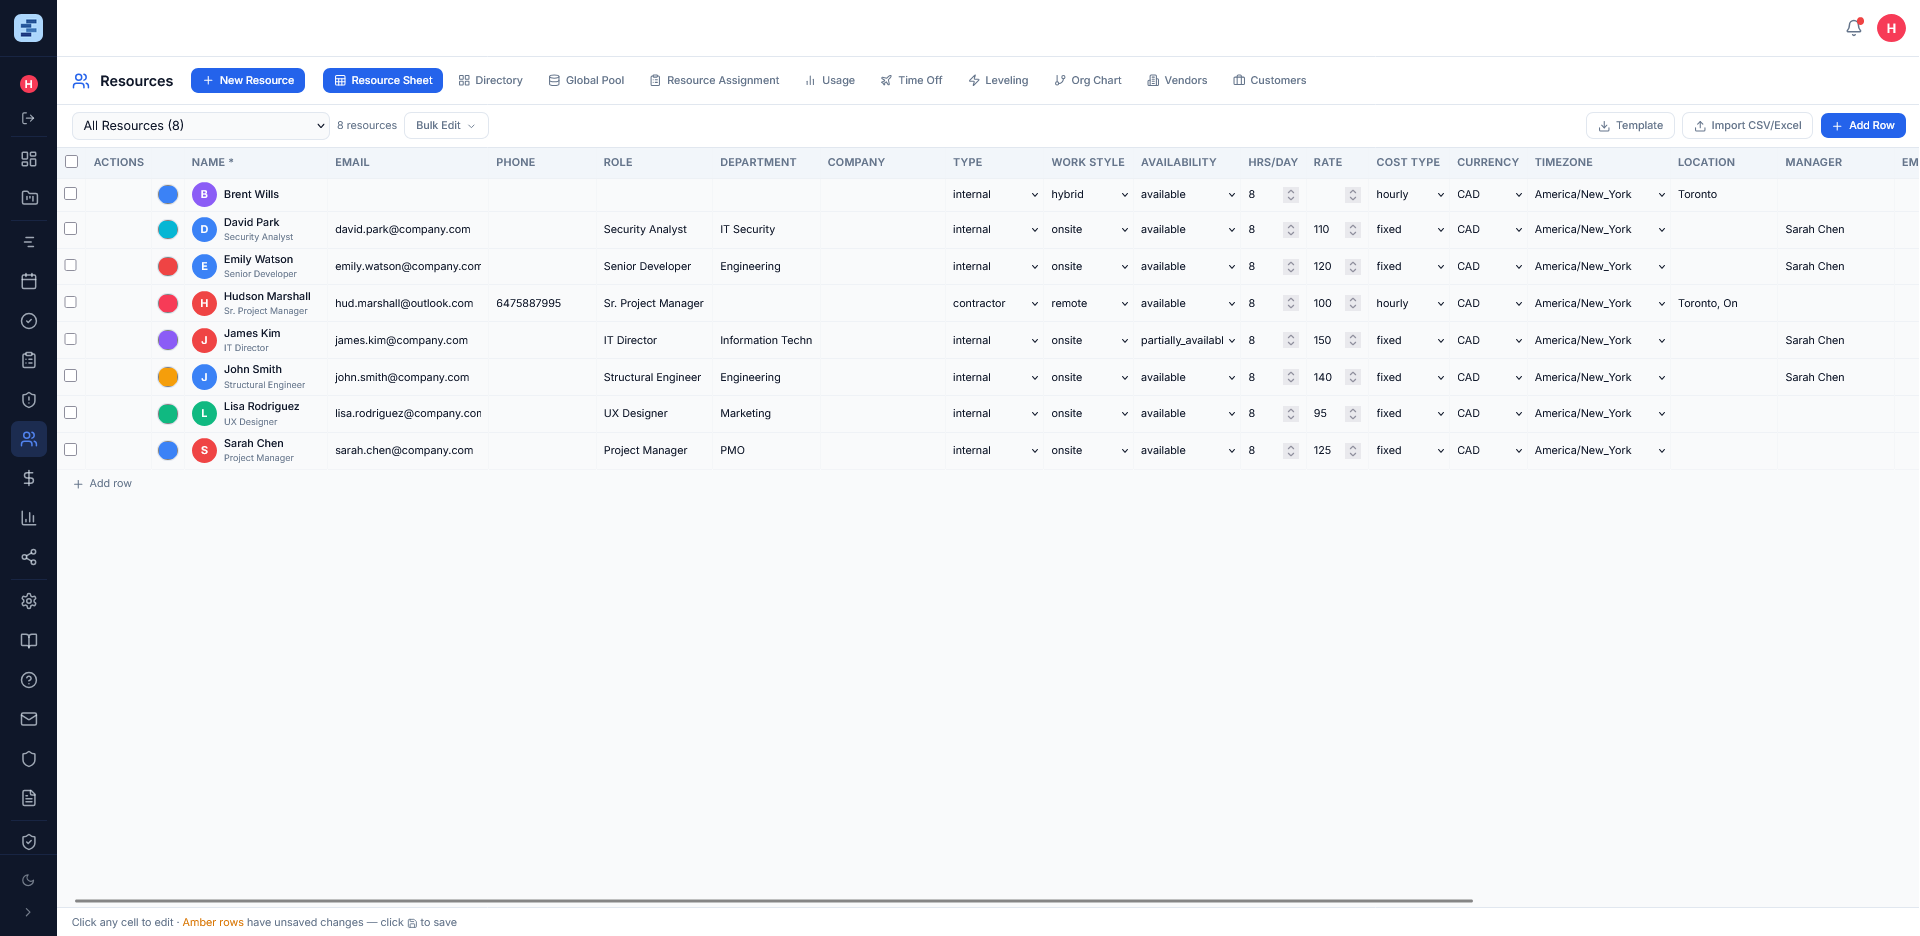
Resource Sheet
Edit the full resource roster in a spreadsheet-grade grid — roles, capacity, rates, availability, and team membership, all inline and instant.
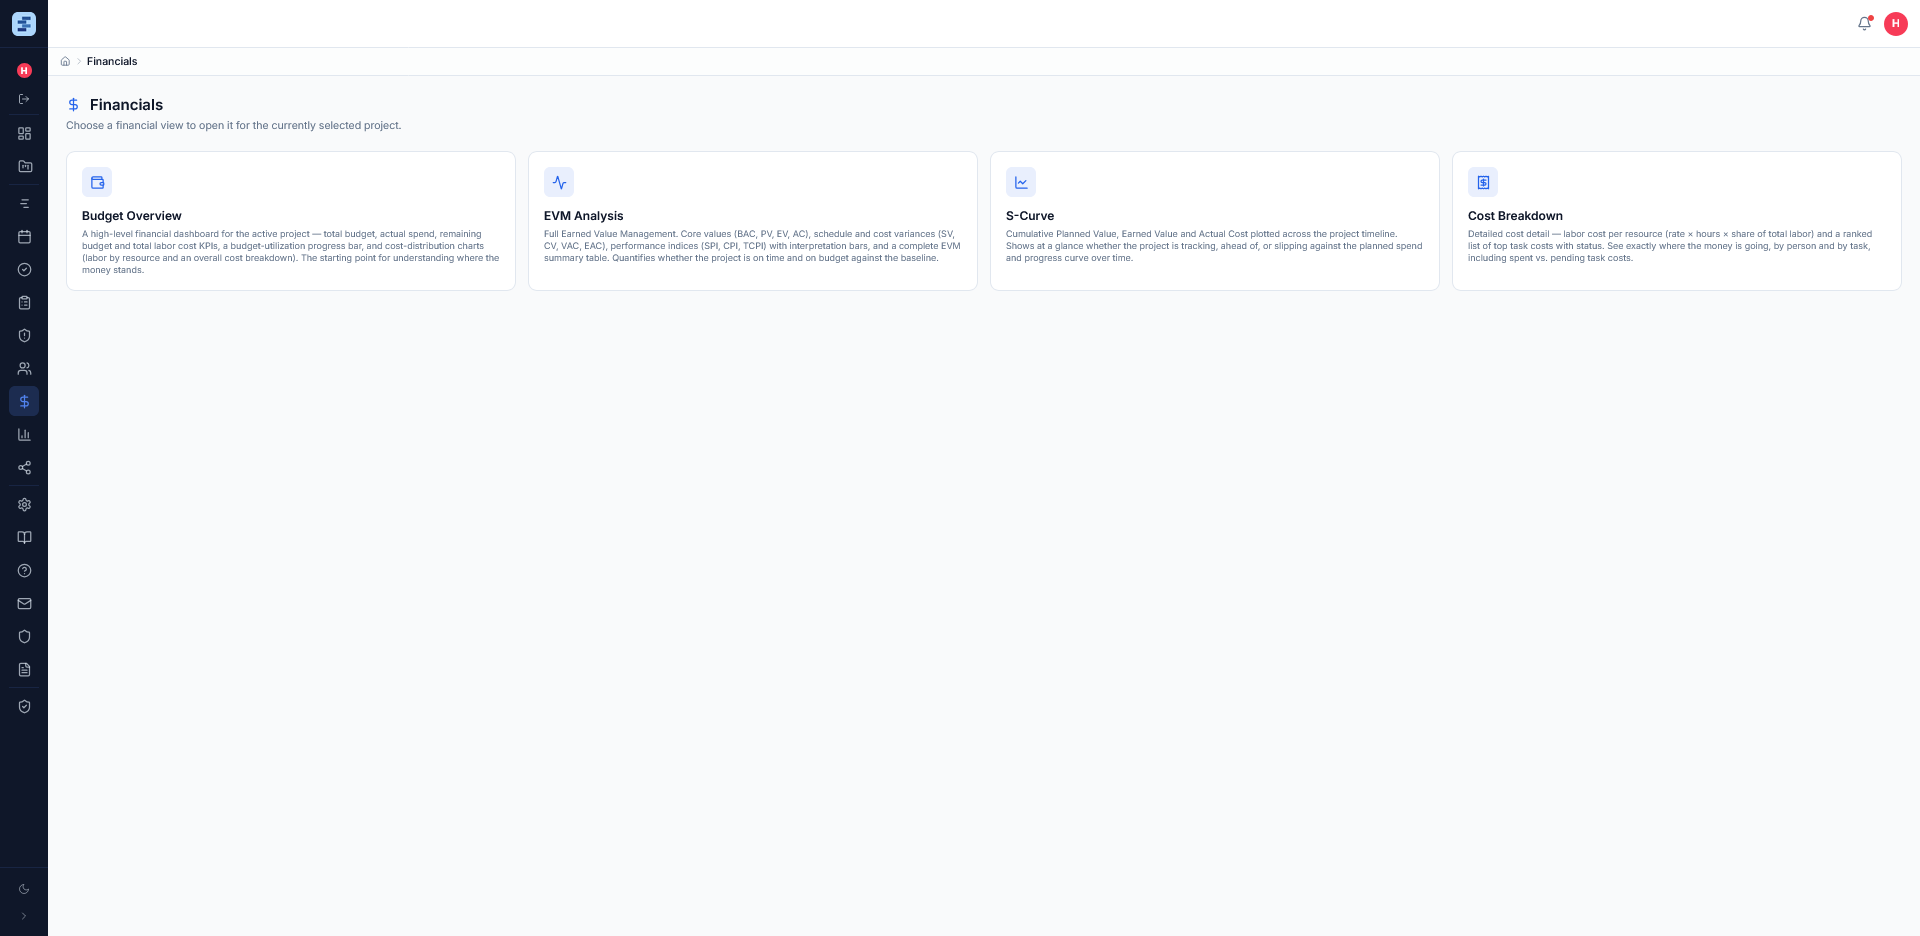
Financials
Four financial views in one workspace — Budget Overview, EVM Analysis, S-Curve, and Cost Breakdown — covering budget, spend, earned value, variances, and per-resource cost detail.
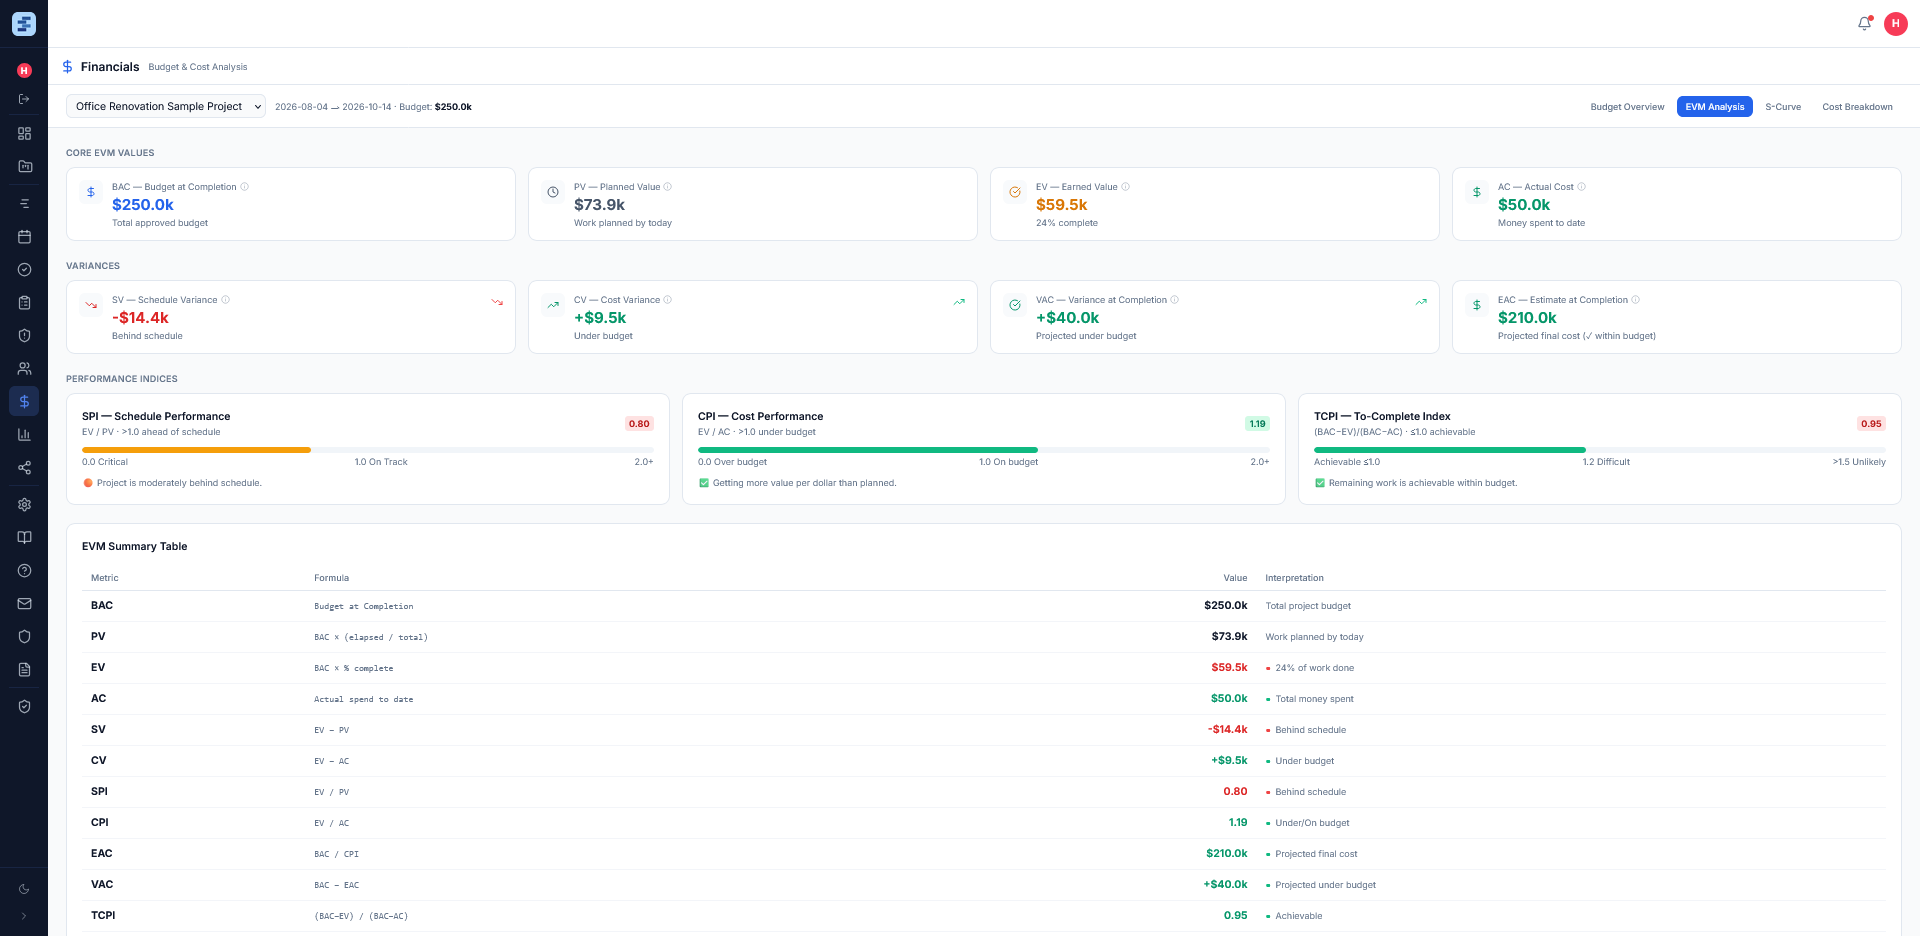
EVM Analysis
Full Earned Value Management — core values (BAC, PV, EV, AC), variances (SV, CV, VAC, EAC), performance indices (SPI, CPI, TCPI) with interpretation bars, and a complete EVM summary table.
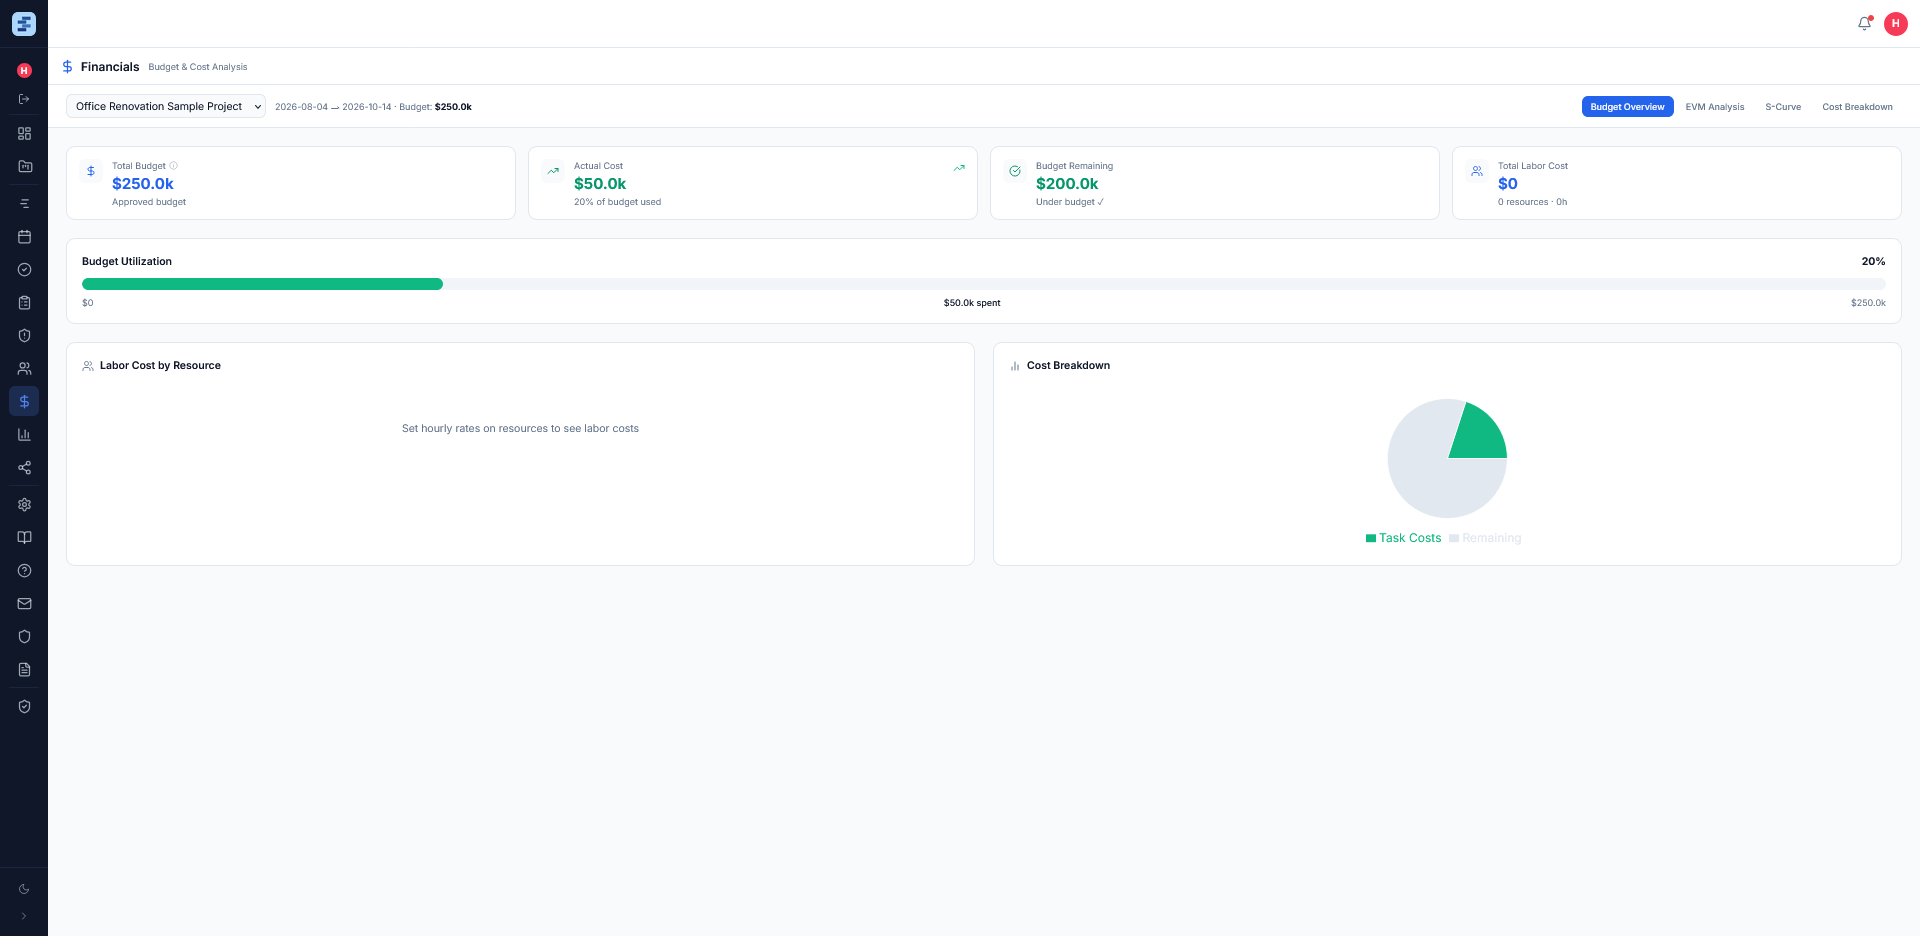
Budget Overview
A high-level financial dashboard — total budget, actual spend, remaining budget and labor cost KPIs, a budget-utilization bar, and cost-distribution charts. The starting point for where the money stands.
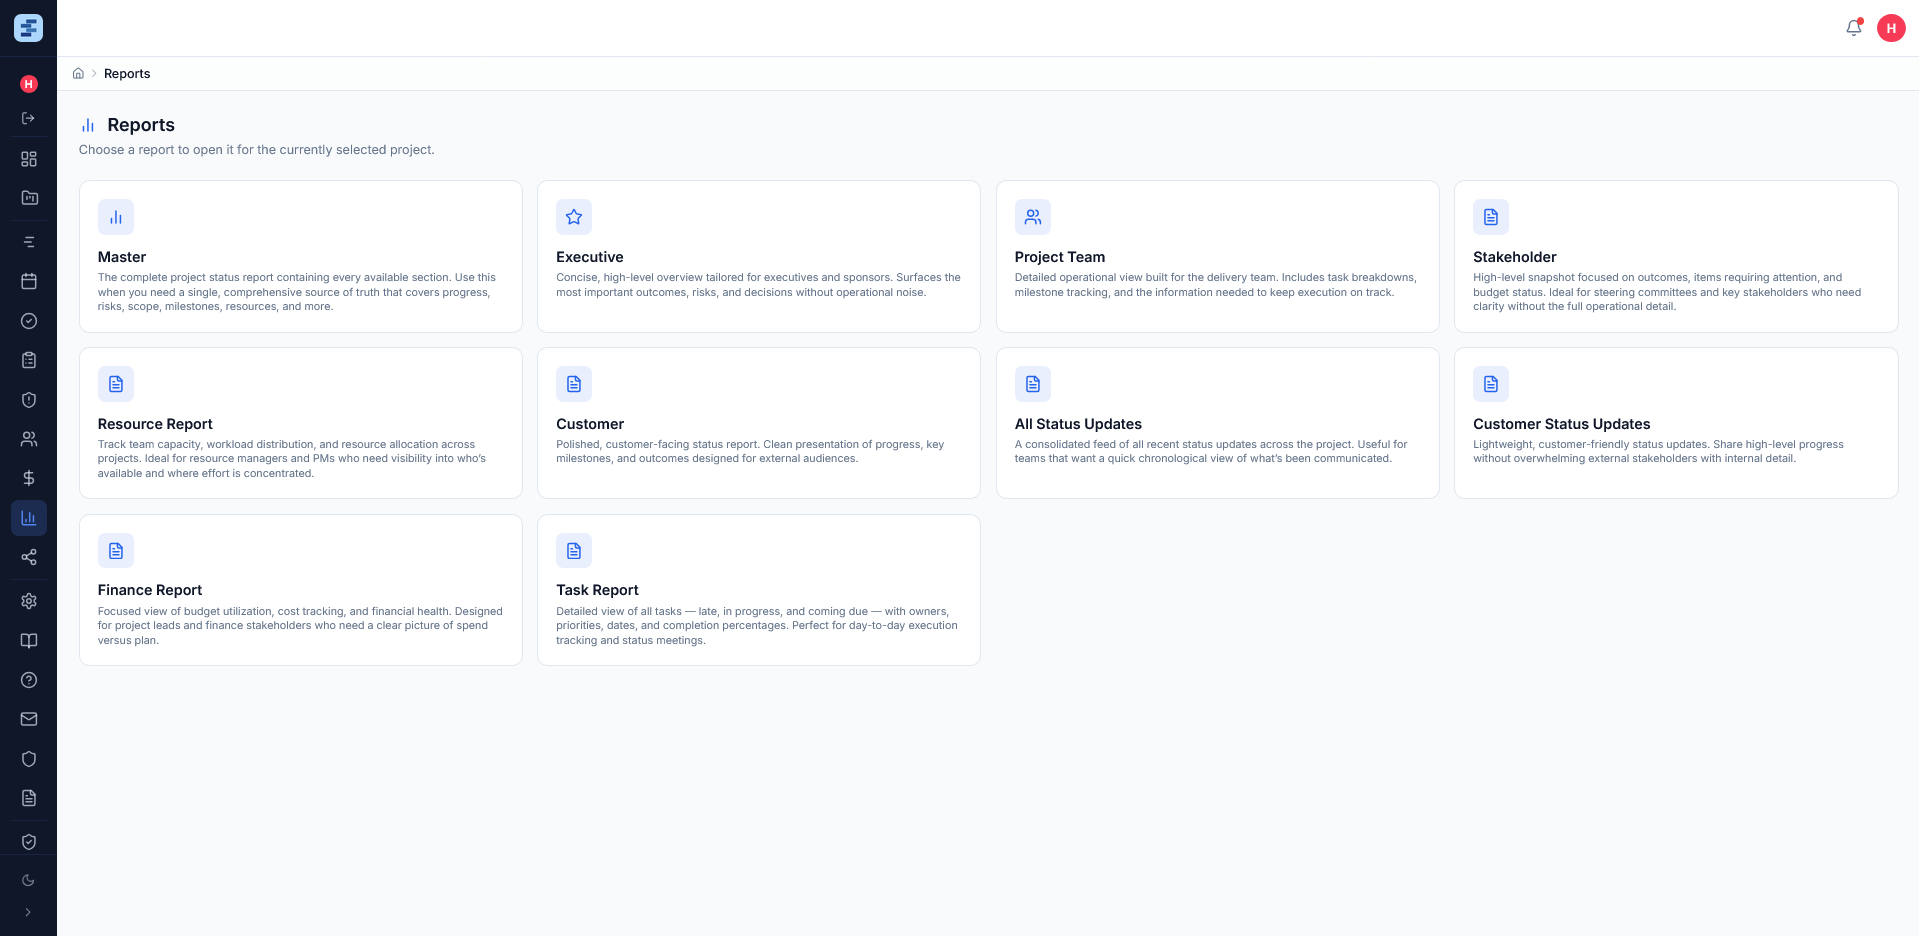
Reports
Generate tailored reports — Master, Executive, Team, Stakeholder, Resource, Customer, Status Updates, Finance, and Task — each shareable as a guest link or PDF.
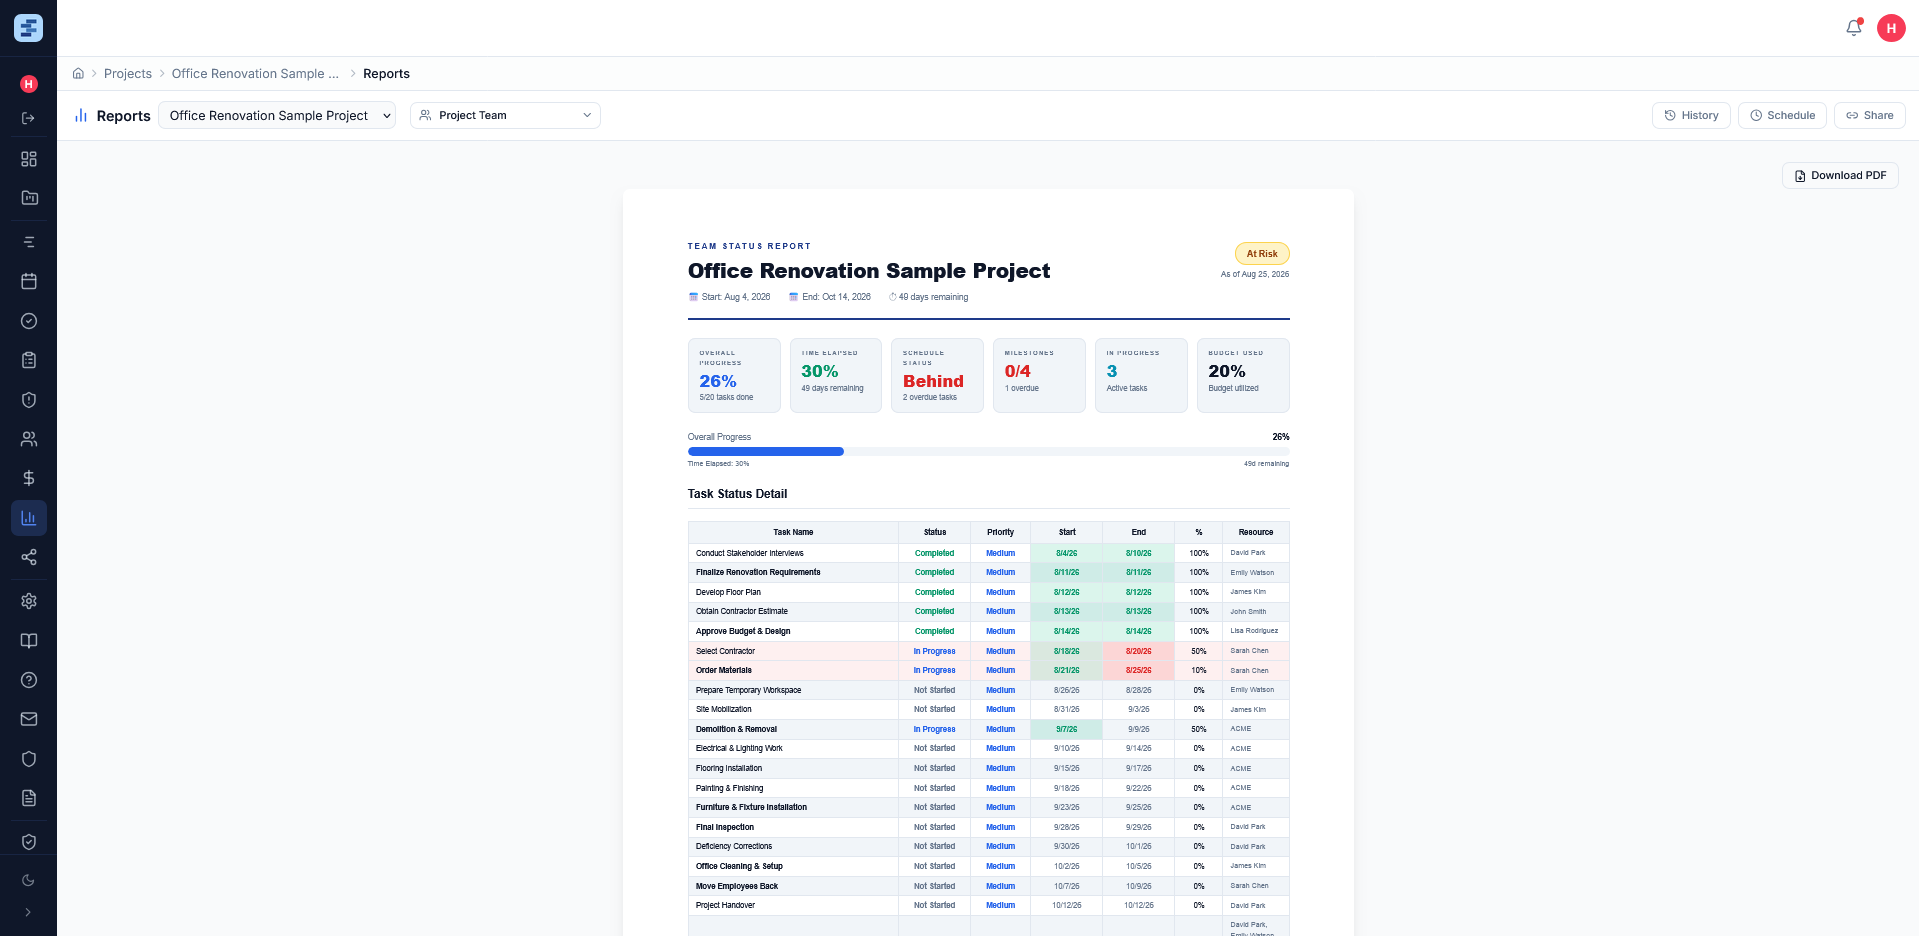
Team Report
Give stakeholders a single-page snapshot of the project — progress, status KPIs, milestones, the team roster, and time off in one shareable report.
View live example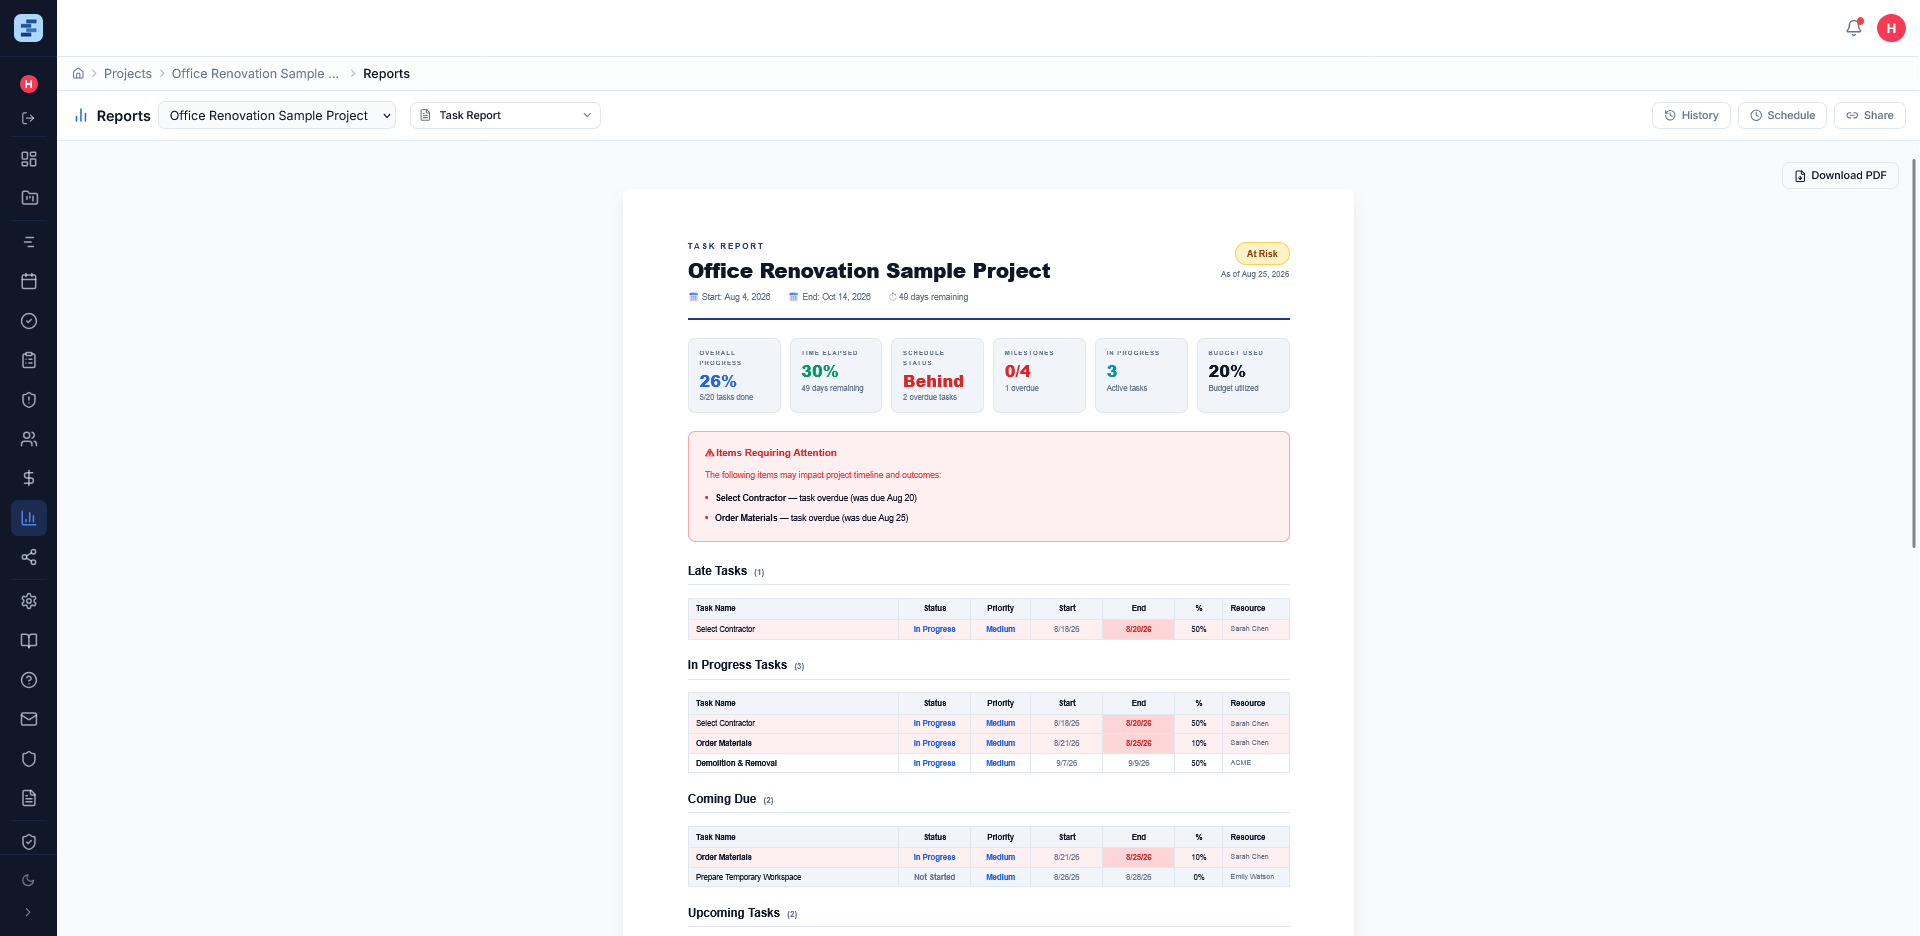
Task Report
Surface every task by status — late, in progress, coming due, upcoming, and completed — with the items requiring attention flagged at the top.
View live example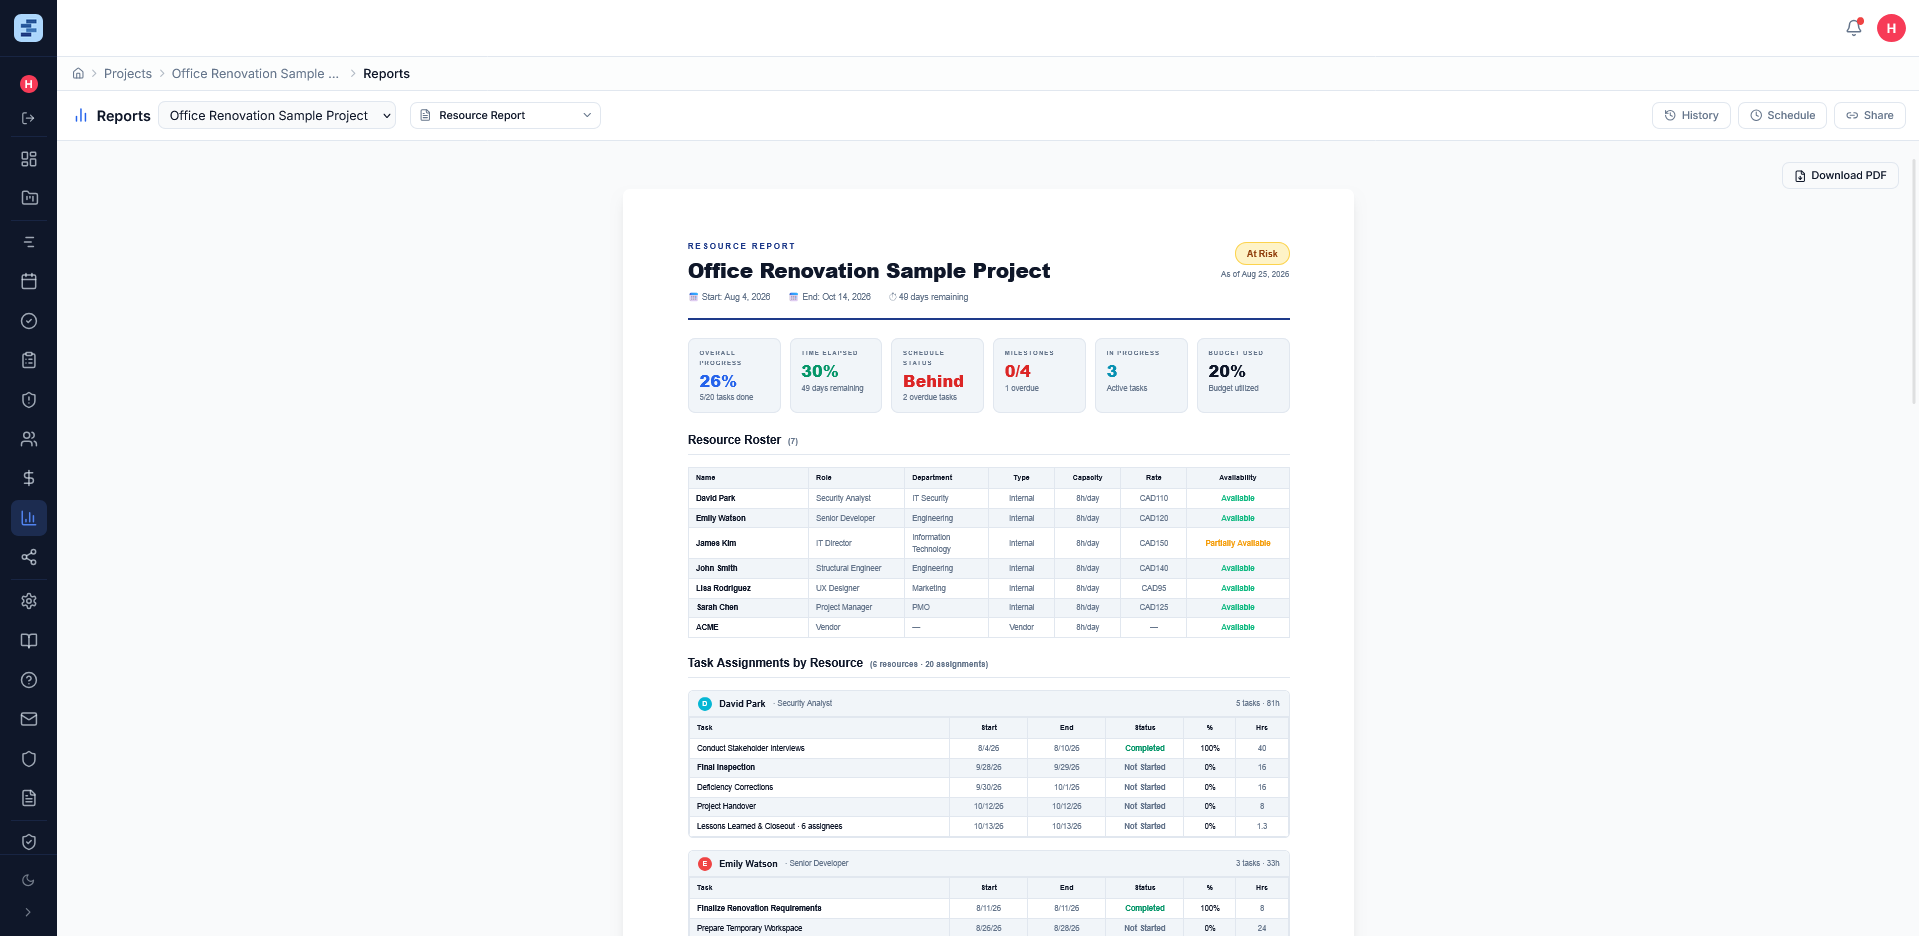
Resource Report
Track the whole team — roster, assignment breakdown per person, utilization, and cost summary — so resourcing decisions are backed by data.
View live example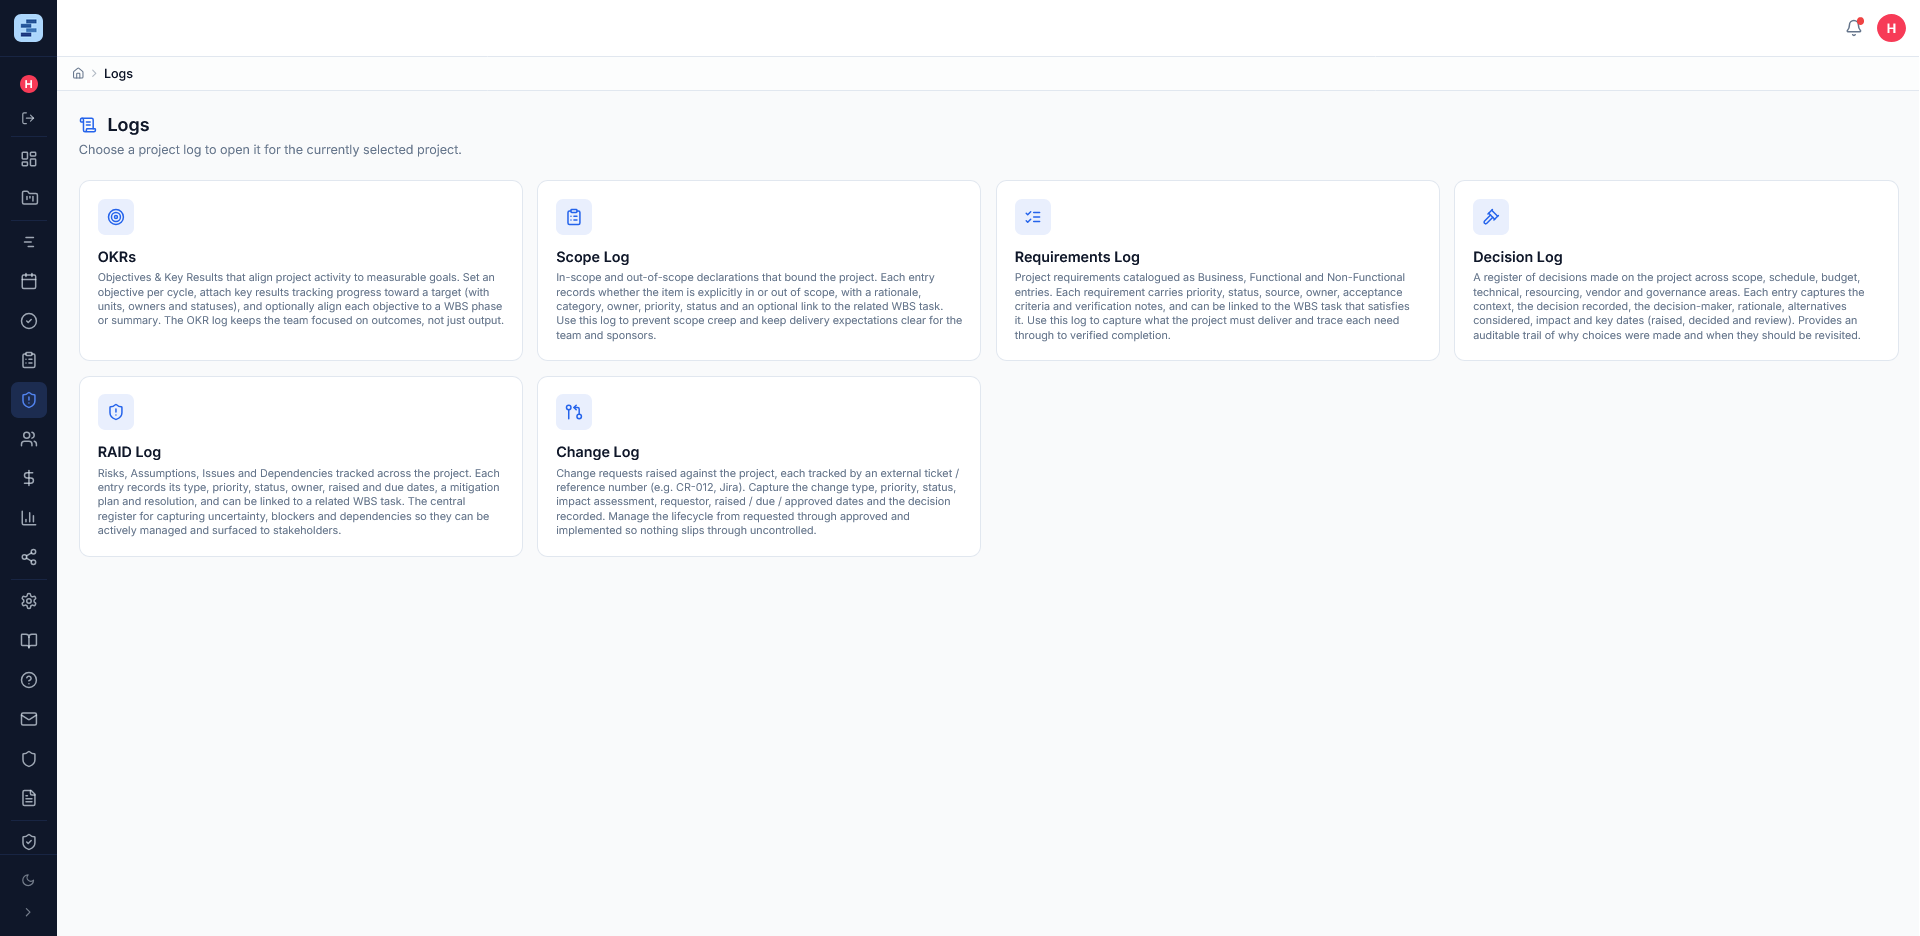
Logs
Six dedicated project logs — OKRs, Scope, Requirements, Decisions, RAID, and Change — each capturing one dimension of project governance in a consistent, filterable register.
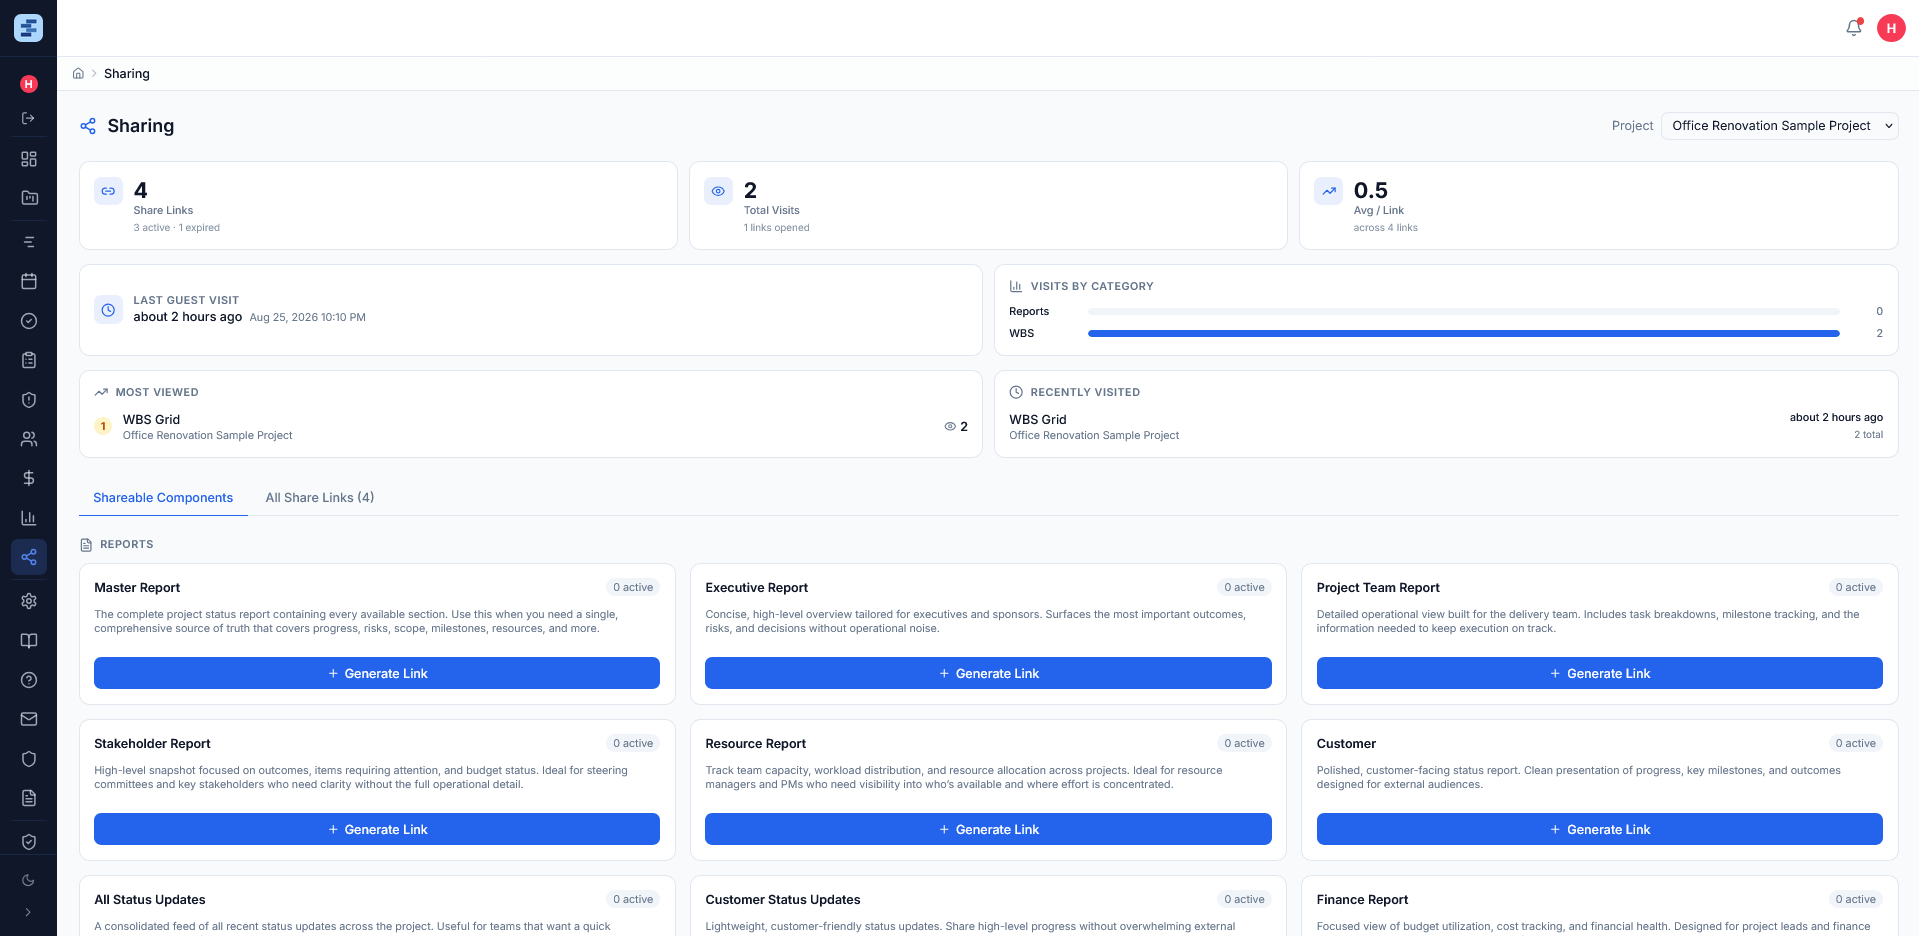
Sharing
Generate read-only guest links for any report, chart, log, or the WBS grid, then track visits and engagement by category from a single dashboard.
Ready to see it in action?
No credit card required — get started in minutes.